
Whether you are trying to increase your sales, expand your reach or create more engaging content, having a detailed understanding of your audience is at the heart of any good digital marketing strategy and will help you to make data driven decisions. Here are a few tips to help you drive the use of data in your business.
How your audience engages with advertising
Advertising is fundamentally about building a connection between your brand and your audience. There are a few basic metrics you can use to evaluate whether your advertising is engaging enough to build that connection.
Link click-through rate
The link click-through rate (LCTR) measures the rate at which users who have seen your ad click-through via the website link. It differs from the click-through rate (CTR) metric, which measures any clicks on any part of the ad, including likes and comments. The LCTR is a more qualified measure of engagement, as users who click through to your website have expressed interest in learning more about your product or service. Average LCTR’s differ across industries, but 0.90% is considered a good benchmark on Facebook.
Where the LCTR isn’t available, using CTR is still a good indicator of engagement, but keep in mind that there will be some low-intent clicks included.

Evaluating engagement on video
View rates and average watch times are excellent metrics to evaluate the effectiveness of video advertising.
What counts as a view? On most channels, a user watching the majority of a video is counted as a view. However, on YouTube, an interaction is counted as a view when:
- Someone watches a complete ad that’s 11–30 seconds long
- Someone watches at least 30 seconds of an ad that’s more than 30 seconds long
- Someone interacts with the ad (e.g. clicks through to site)
A rule of thumb for a good view-through rate (VTR) is 30%, but this can vary across channels and industries.
If your videos are struggling to receive completions, check the average watch time to see how long users are watching for. This can help you evaluate what parts of the video content aren’t appealing to your audience and may need reworking. Here is where a free online video editor comes in handy to revamp your video content and make it attractive for your audience.
A paradox of video advertising is that when you optimise for traffic (clicks), you’ll naturally expect a lower view rate, as more people will be clicking through to the site and not completing the video. While clicks are accounted for in the view rate on YouTube, it’s definitely something to keep in mind across other channels, like Facebook and LinkedIn. As with all advertising activity, it’s important to analyse the metrics with the full context of the campaign objectives and setup in mind.
Wrong ad or wrong audience?
It’s key to test different audiences in your campaigns. This can help you understand whether your ads need improving (engagement is low across all audiences) or, if particular audiences aren’t interested in your brand (low engagement compared to other audiences).
Using Google Analytics to analyse your website
Google Analytics (GA) is a free tool that you can use to track your audience’s engagement and behaviours across your website. GA has a plethora of ways that you can analyse data, from audience demographics, web page views and traffic sources. It is easy to get lost in the data but here are two simple ways to use GA to your advantage when it comes to understanding your audience.
Of course, you'll need to have a way to store and arrange all this data as well. The experts from https://nfina.com/
Traffic sources
Analysing your traffic sources month-to-month is an effective way to see what channels have been performing well and conversely which channels may need attention. Organic traffic drops can indicate a fall in either SEO or a lack of need for your product if your business is seasonal. GA allows you to compare days, weeks, months and even years. Comparing February 2021 traffic sources to February 2020 traffic sources for example can give you a good idea of which channels have increased given your marketing efforts, where your audience is most likely to reach your page from, and where you may need to rethink your marketing strategy on other channels.
Bounce rates & time on page
Bounce rates & time on page can give you a good indication as to whether or not your page's content is resonating with your target audience. High traffic pages that have high bounce rates and low time on page usually will mean that although the page title, or way you acquired the traffic to your page, resonated with your audience, the actual content on that page has missed the mark. Run through your highest bounce rate pages with a fine tooth comb and make some assumptions as to where you are missing the mark.
Imagine the typical journey a user makes on your website, and see how these metrics stack up as you move through the process. Whether it’s the catalogue page, product page, or even the add to cart sequence, this can help you identify where users drop off, and allow you to best focus your website optimisation efforts.
Are your emails hitting the mark?
Whether you are using MailChimp and only emailing your database once per month, or a more sophisticated CRM like HubSpot with full fledged nurture campaigns, you should be analysing your email statistics on a regular basis. Here are two simple ways to use email statistics to better understand your audience.
Open rates (OR) and click-through rates (CTR)
Open rates (OR) and click-through rates (CTR) are two important metrics that you can use to quickly analyse your audience's behaviour on an email. Low open rates can imply that your subject line wasn’t compelling enough or that your database health needs attention; meaning your audience may not be engaged enough from the outset. High OR’s and CTR’s imply that the messaging and offer in the email has hit the mark. An average OR sits between 15-25% depending on your industry and CTR around 2.6%. Couple this data with your Google Analytics data and you’ll be able to paint a detailed picture of your audience's journey and make more data-driven decisions across your marketing strategies.
Unsubscribe rates
Unsubscribe rates will tell you what proportion of your email database have unsubscribed from your emails. High unsubscribe rates are a cause for concern; this doesn’t just mean that your emails aren’t engaging, it means that the user has gone out of their way to stop receiving further communications from you. A typical benchmark for unsubscribe rates is 0.10%. If you’re sitting higher than this, look at your email schedule and identify where the majority of the dropoff occurred. Generally, a massive driver of subscriber attrition comes from too high a frequency of emails, or irrelevant and annoying content. Aligning your schedule with the data is crucial in diagnosing how to improve your email marketing strategy.
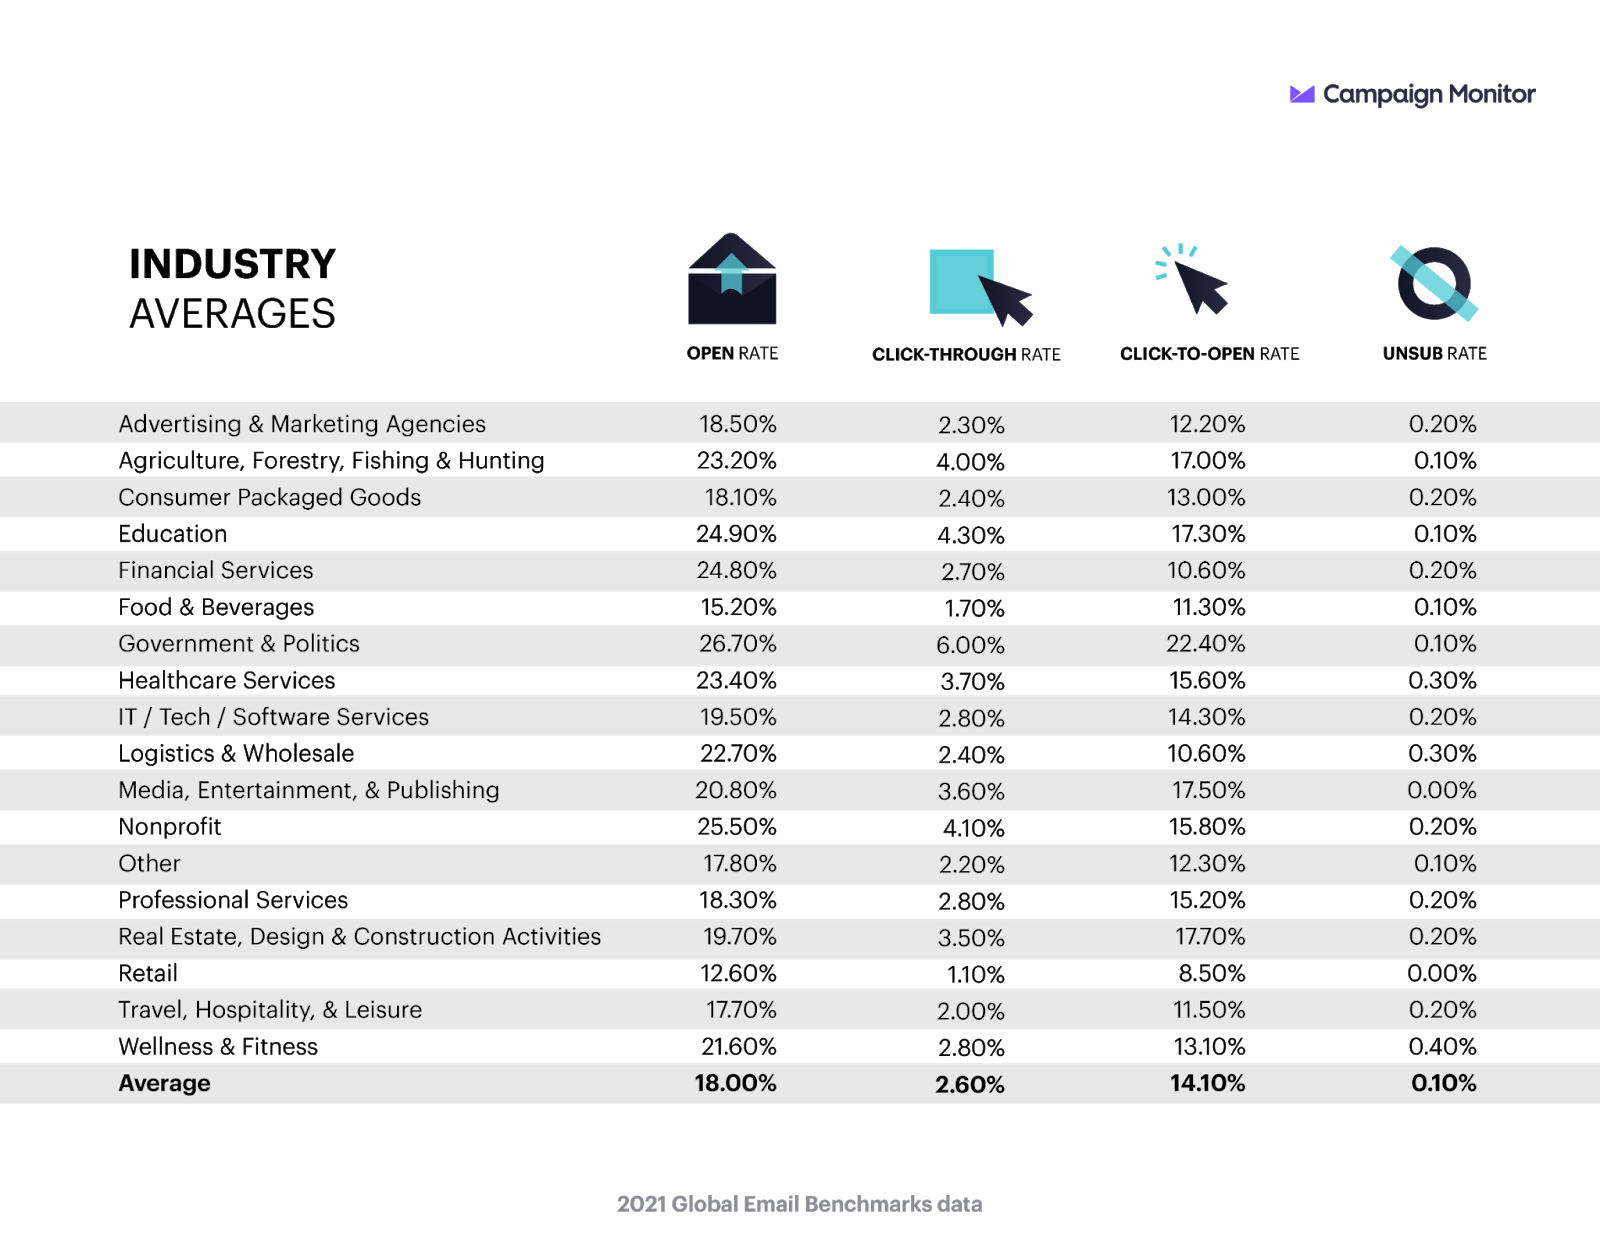
Benchmarking performance
Campaign Monitor is one of the largest email marketing companies in the world. Between January and December 2020, they evaluated over 100 billion emails sent across a whole range of industries. Below is a breakdown of how each industry performed against some key email marketing metrics. How does your email marketing compare?
Take your data with a grain of salt
Mark Twain once said that there are three kinds of lies: lies, damned lies, and statistics. The data itself won’t tell you the whole story, but if you know what to look for and how to analyse multiple data points in context, you’ll be able to better understand your audience, and improve your marketing as a result.
Resources
Want more resources to improve your marketing? Make sure you check out our free Marketing Plan Template, and our Profitable Facebook Ads Short Course! There’s also plenty more for you to explore in our Resource Centre, packed full of eBooks, templates and short courses to help you launch, build and grow your business.